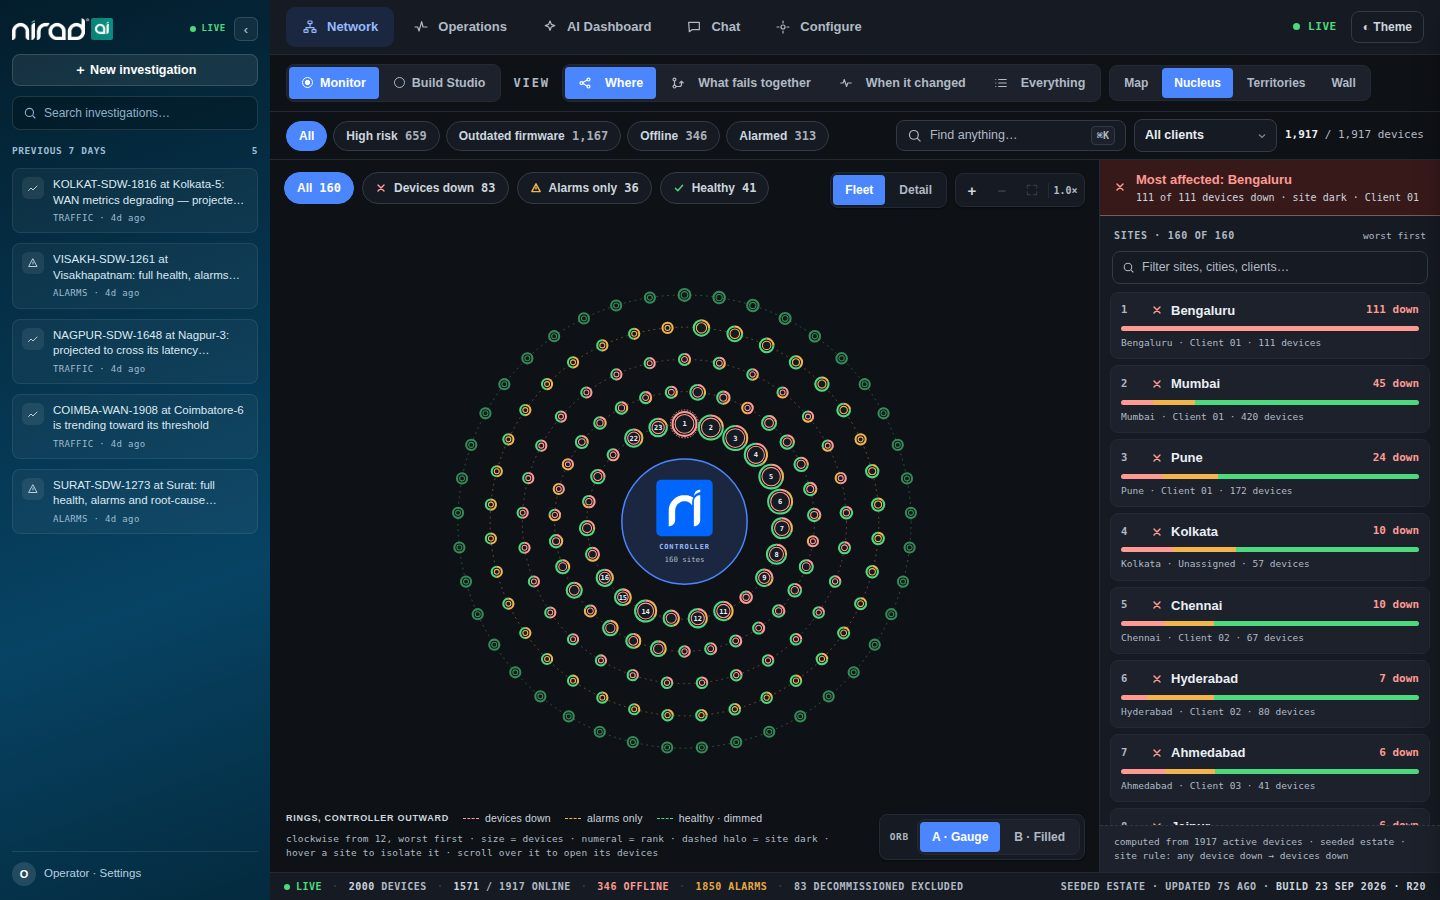
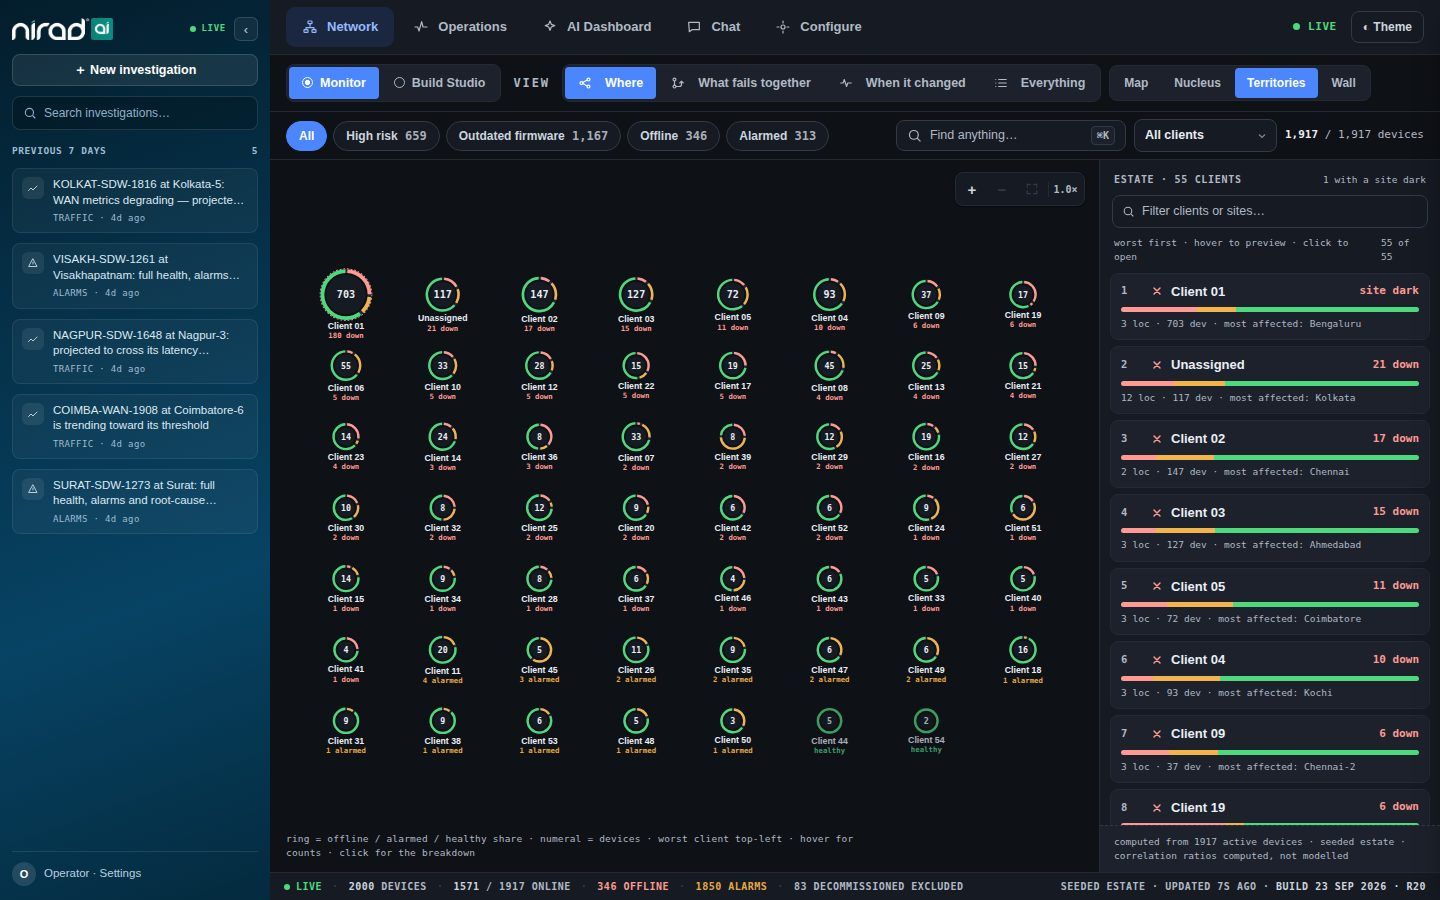
Why this project is a stretch
My UX background is websites and marketing funnels. An operations console is a different discipline: dense, stateful, used under pressure, by experts who will notice every wasted pixel. I took it on knowing that, and set the project up to compensate. Before any design work I ran customer interviews to hear how engineers actually use the console day to day, then combined what they told me with the full product context and the constraints into a working brief and a phased plan.
What was wrong with V1
I audited the first version screen by screen. Four problems stood out:
- A decorative topology. The network was drawn as concentric rings. It looked good with a handful of sites and stopped being readable as the fleet grew.
- Colour as mood, not state. Colour was used to make screens feel alive rather than to tell an engineer what was healthy, degraded or down.
- Weak contrast in places where the information mattered most.
- Inconsistent density. Some screens were sparse, others crowded, with no system behind either.
Each finding became a design principle, so the audit doesn't just describe the old product. It constrains the new one.
V1 What I found
Principle What replaces it
Each audit finding became a rule the new screens have to follow.
Who it's for
The users are network engineers at customer organisations, not the partners who sell the product. I set triage as the primary mode: the engineer opens the console because something needs attention and wants to find it fast. Ambient wall-screen monitoring is secondary.
That's a working assumption, not a finding, and I've recorded it as one. It still needs confirming with a real engineer before the rest of the screens are built on it.
What I'm borrowing, and from where
| Product | What I'm taking from it |
|---|---|
| Datadog | Information density and disciplined use of colour |
| Grafana | A customisable panel model |
| Cisco Meraki | Fleet lists and device-detail patterns |
| Juniper Mist | How an AI verdict is presented to an engineer |
One rule runs through all of it: the AI recommends and the engineer decides. The interface never presents an AI action as already taken.
How the work is sequenced
- Design language first. Type, colour for state, density and components, in light and dark mode.
- The AI Dashboard as the proving ground. It's the screen the CEO demos, so it's the first real test of the system.
- The remaining screens, built on the proven system.
Desktop is the priority, with mobile as a secondary target that doesn't block anything. The prototypes are handed to engineering to build in production.
Where the redesign stands.
Where it stands
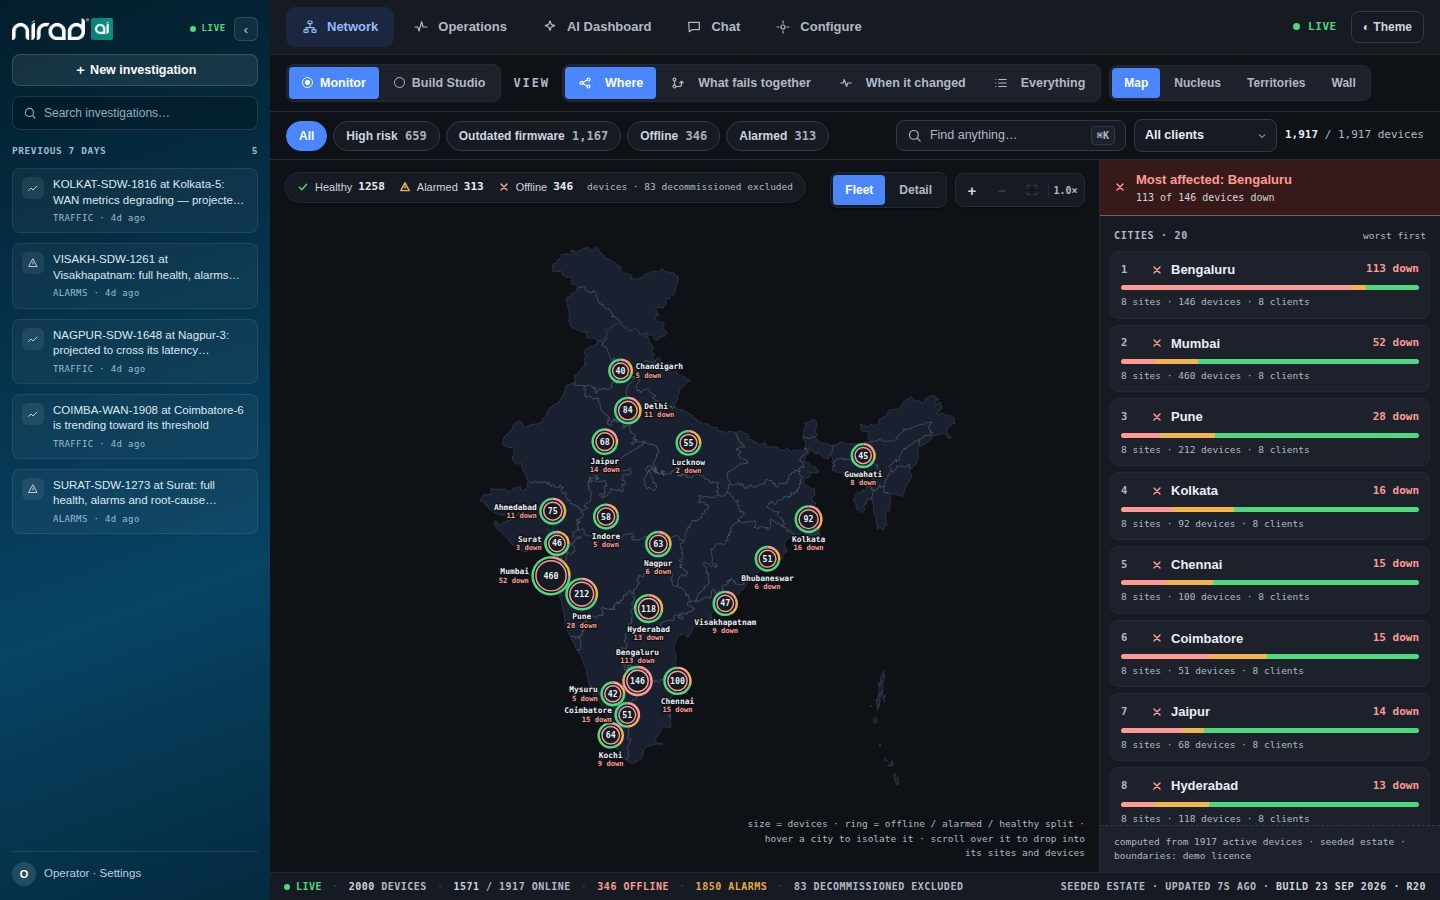
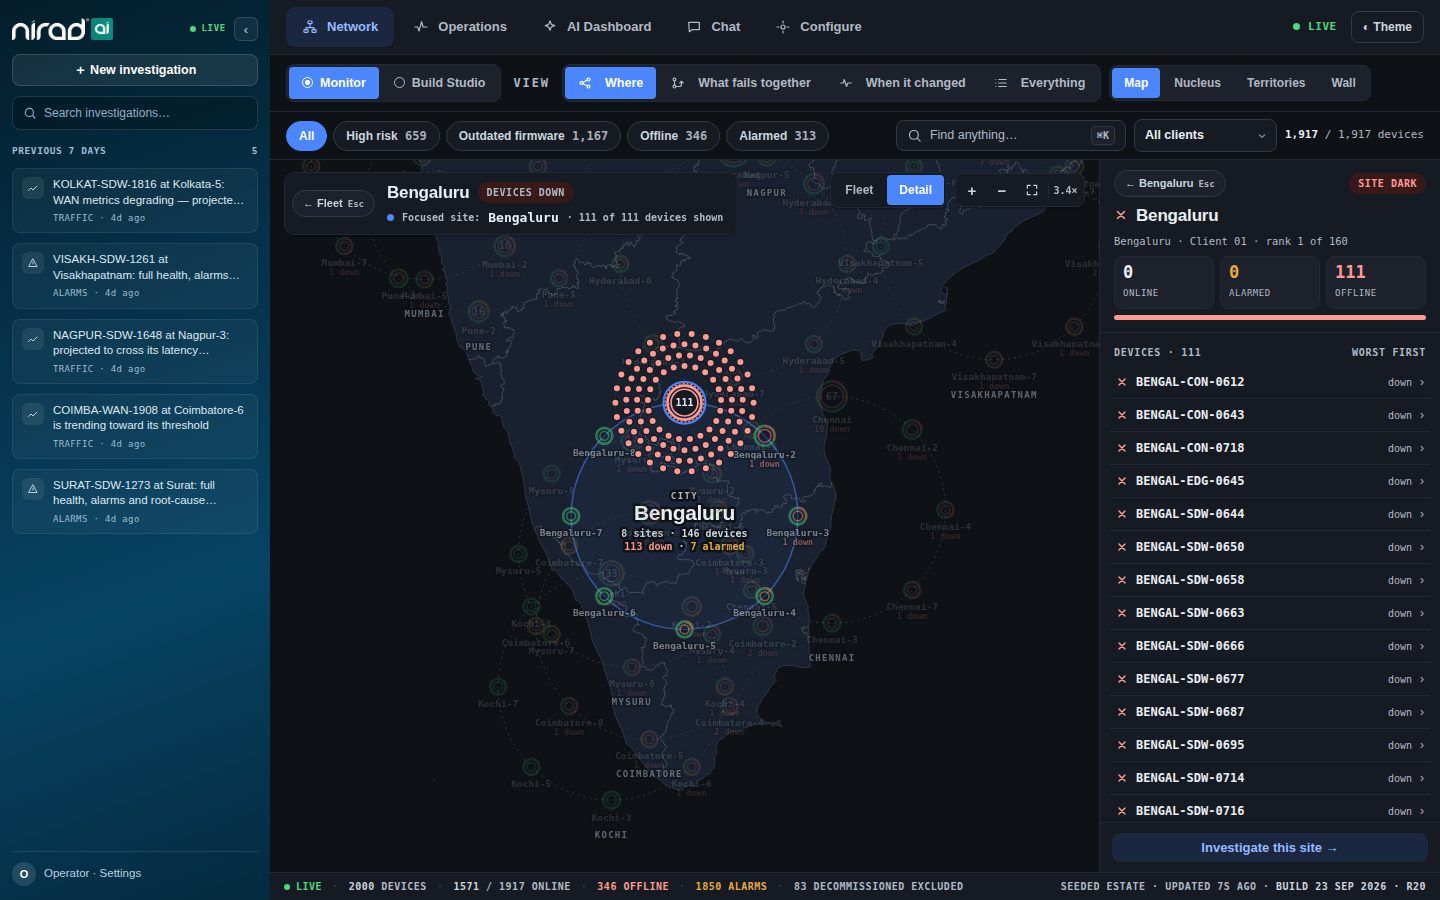
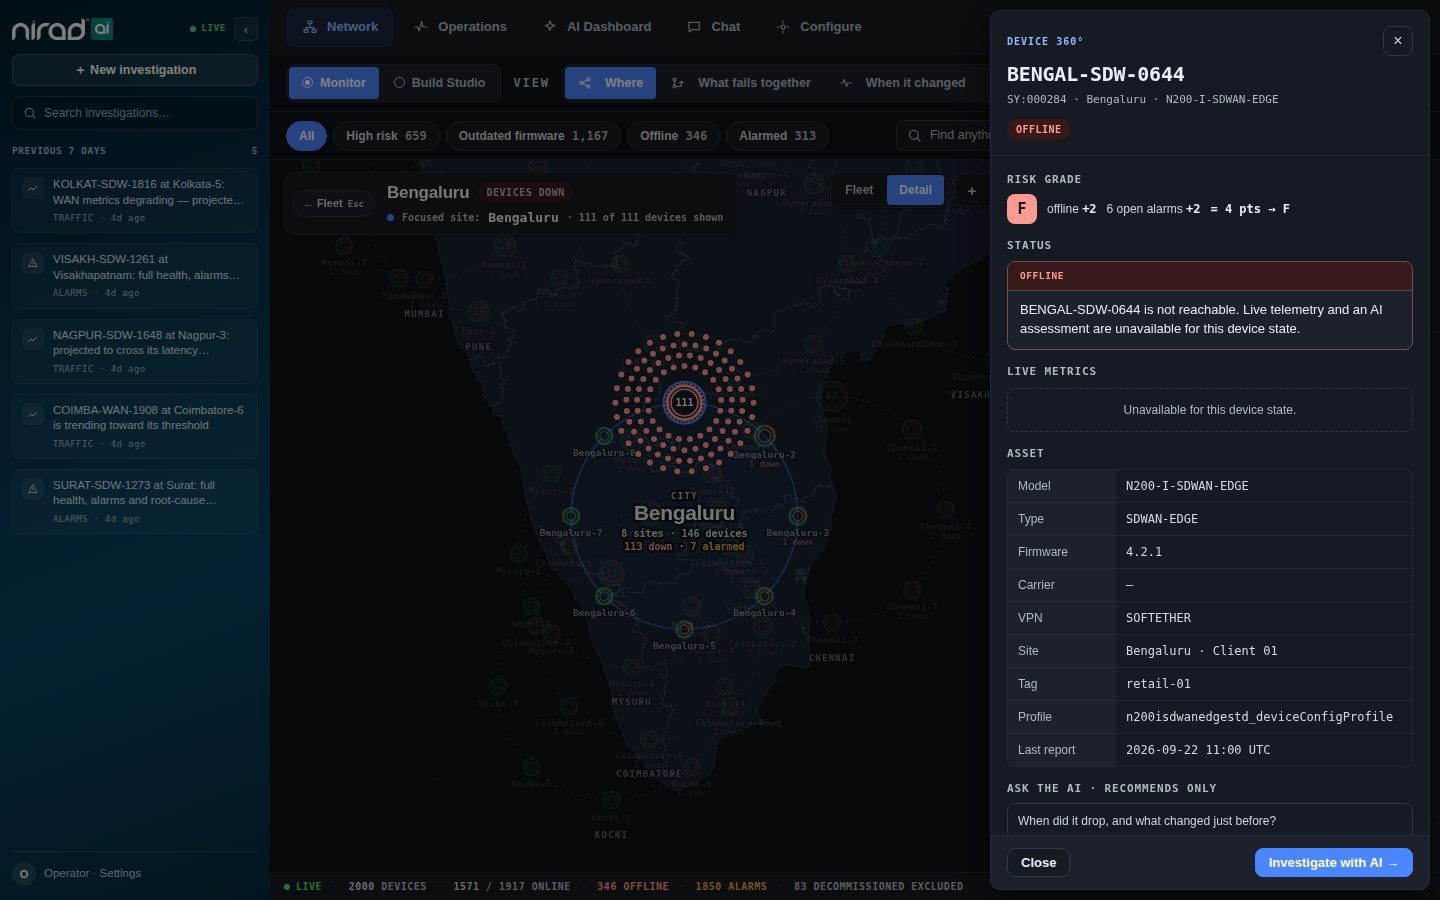
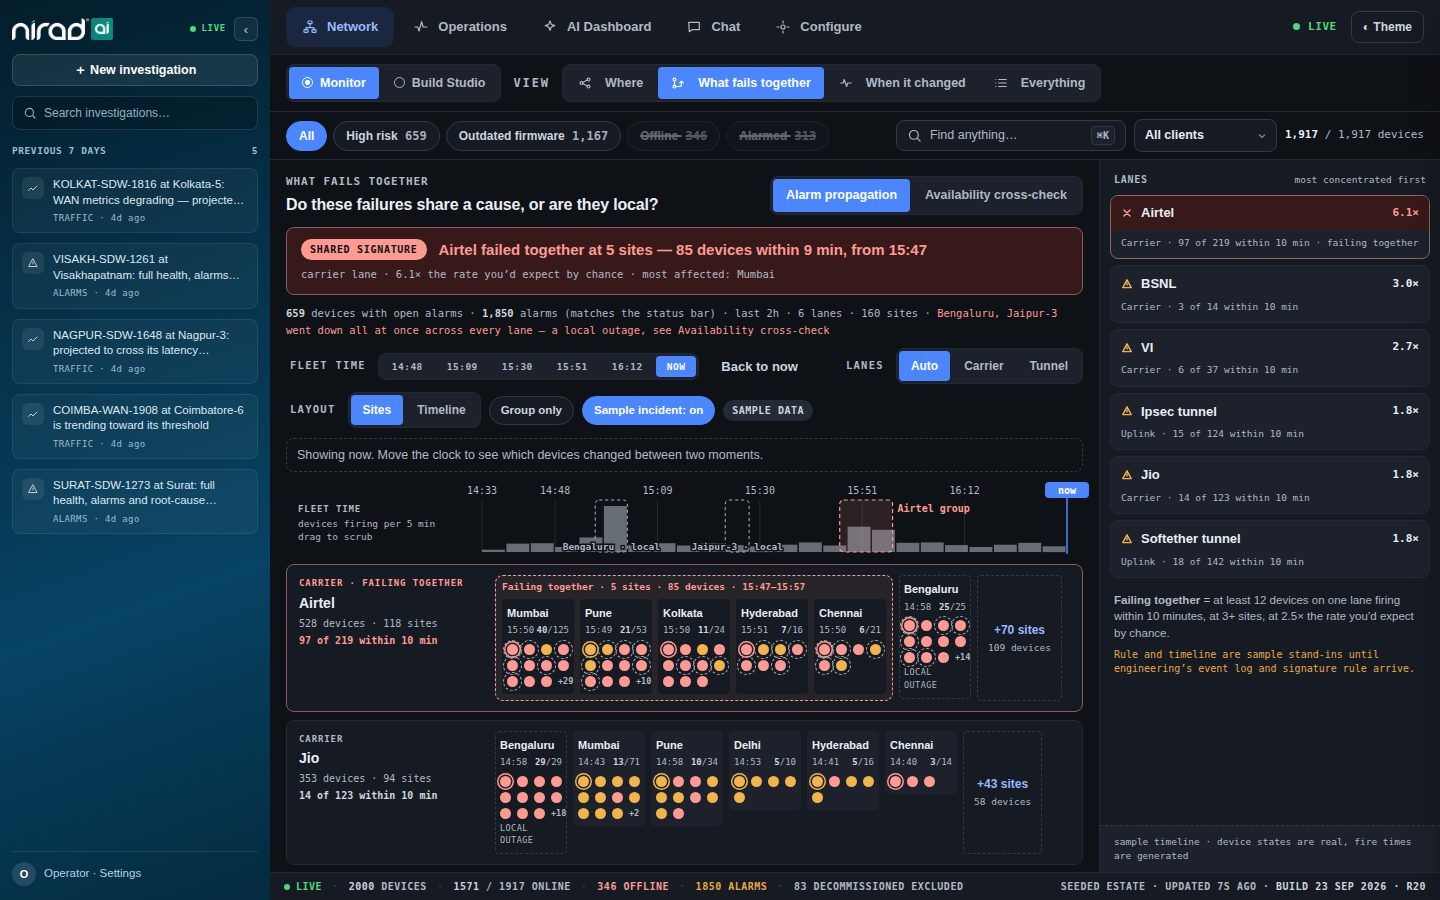
What you see at the top of this page is V2: a working prototype of the Network screens, running on sample data. It is not the final build. The design language is set, the fleet, city, device, correlation, Nucleus and Territories views are clickable, and the prototype is handed to engineering to build in production. The final build will change as engineering connects real event data.